
The idea behind this post was born after a conversation with Simon
Valdez-Juarez, a fellow graduate student at SFU. He mentioned an idea he had
for creating a Shiny web app that
allows people to see the evolutionary distinctiveness of bird species in their
eBird checklists. Given that I have played around with wrangling eBird
checklists to display summary stats of sightings by location and year (the
myebird package, see a previous blog
post about it here), we decided to join
forces to create this website. The functions introduced below will be the
backbone of such a project.
What is ED?
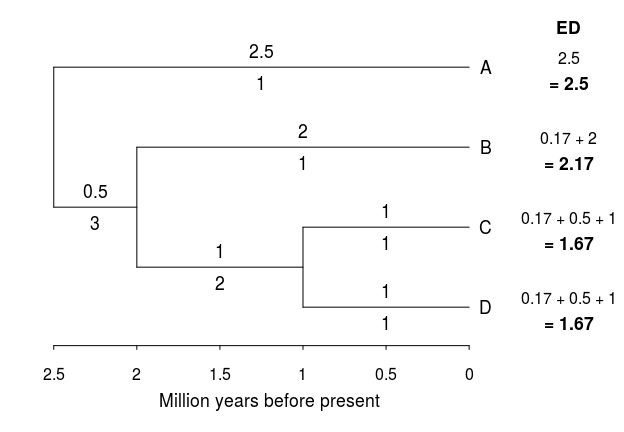
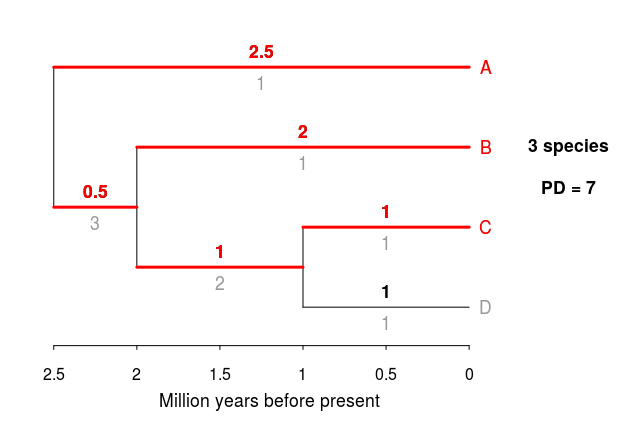
Evolutionary Distinctiveness (ED) is a measure of species’ relative contributions to phylogenetic diversity. It is calculated by dividing the total phylogenetic diversity of a clade among all its members. David Redding, a former PhD student at SFU, came up with the idea of ED for his M.Sc. thesis at the University of East Anglia. Simply put, the ED score of a species is the sum of all the branch lengths to the root of the tree, each divided by the number of species each branch section is shared among. I’ll illustrate this using four hypothetical species (A, B, C, and D). For each branch, the number above represents the length of the branch (in million years), while the number below the branch shows the number of species that share that branch, so ED is the sum of all these fractions from the root of the tree to each tip (Figure is adapted from Isaac et al. [2007]):
ED is a pretty straightforward metric that can help identify individual (perhaps flagship?) species of high evolutionary distinctiveness.This metric can be combined with a threat score based on the Red List status compiled by the International Union for the Conservation of Nature (IUCN). The Red List status of each species can be converted to a quantitative measure by converting qualitative status into ordered integers, in this case denoted as GE: thus a species assess as “Least Concern” would have a GE score of 0, a “Near Threatened” species would be scored as a 1, and so on up to a species assessed as “Critically Endangered”, which would have a score of 4. Thus, by using Evolutionary Distinctiveness (ED) and Global IUCN Red List status (GE) you can create a composite score of Evolutionary Distinctive and Globally Endangered (EDGE) species. The one proposed by Isaac et al. (2007) and subsequently used by Jetz et al. (2014) on birds is as follows:
\[EDGE = ln(ED + 1) + GE * ln(2)\]The data from Jetz et al. (2014) include a bird phylogeny covering almost 10,000 species (available here) and their associated EDGE scores and ranks (available here); these data are the basis for these R functions and I would not have been able to create them without their work.
The myedge and mypd functions
To being playing with bird trees and your eBird data, you first have to
install the myebird package from GitHub using
devtools::install_github and load it in R:
devtools::install_github("sebpardo/myebird")
library(dplyr) # for piping and data wrangling
library(myebird)
library(ggplot2)
There are three functions in this package that I’ve already written
about here (ebirdclean,
myebird, and myebirdcumul). I have added two new functions: myedge
and mypd, as well as a dataset named edge.
To use these functions, we first need to download all our data from
eBird: an email with a download link will be sent to you after pressing
“Sumbit” in the following eBird link (make sure you’re logged in to
eBird!): http://ebird.org/ebird/downloadMyData. We then clean this csv
file using the ebirdclean function:
mybirds <- ebirdclean("MyEBirdData.csv")
To obtain ED scores as well as EDGE scores and ranks of the species
included in your eBird checklist, you can simply use the myedge
function, whose first argument is the output provided by ebirdclean,
and the second argument is edge.cutoff, which is the cutoff for
species to be shown in terms of ranking (defaults to returning all
species):
myedgebirds <-myedge(mybirds, edge.cutoff = 500)
myedgebirds %>% select(-sciName)
## # A tibble: 12 × 5
##                     comName  ED.Score EDGE.Score EDGE.Rank
##                       <chr>     <dbl>      <dbl>     <int>
## 1    Peruvian Diving-Petrel 28.418480   5.461065        29
## 2  Australian Painted-Snipe 26.901620   5.408126        32
## 3             Andean Condor 43.702267   4.493171       228
## 4          Marbled Murrelet  8.815285   4.363382       277
## 5       Hutton's Shearwater  8.341314   4.313888       293
## 6           Andean Flamingo 15.887414   4.212863       339
## 7              Magpie Goose 62.675689   4.153803       372
## 8                    Osprey 56.063247   4.044160       431
## 9                Great Knot 12.885775   4.017159       451
## 10         Beach Thick-knee 26.631221   4.012094       459
## 11   Yellow-nosed Albatross  5.730249   3.986054       471
## 12        Providence Petrel 11.894030   3.943059       500
## # ... with 1 more variables: sciName.edge <chr>
We can also easily subset to see the ED and EDGE ranks and scores for a single country or even region:
mybirds %>%
  filter(Country == "Chile") %>%
  myedge(edge.cutoff = 1000) %>%
  select(-sciName)
## # A tibble: 15 × 5
##                         comName  ED.Score EDGE.Score EDGE.Rank
##                           <chr>     <dbl>      <dbl>     <int>
## 1        Peruvian Diving-Petrel 28.418480   5.461065        29
## 2                 Andean Condor 43.702267   4.493171       228
## 3               Andean Flamingo 15.887414   4.212863       339
## 4        Black-browed Albatross  5.340944   3.926469       509
## 5     Diademed Sandpiper-Plover 23.787857   3.903501       525
## 6              Peruvian Pelican 22.821709   3.863744       553
## 7               Westland Petrel 10.252474   3.806882       599
## 8              Chilean Flamingo 20.040577   3.739600       657
## 9          White-chinned Petrel  8.965589   3.685432       704
## 10             Humboldt Penguin  8.335894   3.620161       754
## 11            Pied-billed Grebe 35.996441   3.610822       763
## 12 South American Painted-Snipe 34.544290   3.570780       805
## 13                Black Vulture 33.390317   3.537775       858
## 14             James's Flamingo 15.887414   3.519716       875
## 15              Royal Albatross  7.167664   3.486477       931
## # ... with 1 more variables: sciName.edge <chr>
mybirds %>%
  filter(County == "Metro Vancouver") %>%
  myedge(edge.cutoff = 1000) %>%
  select(-sciName)
## # A tibble: 6 × 5
##                  comName  ED.Score EDGE.Score EDGE.Rank
##                    <chr>     <dbl>      <dbl>     <int>
## 1       Marbled Murrelet  8.815285   4.363382       277
## 2                 Osprey 56.063247   4.044160       431
## 3      Red-throated Loon 49.484481   3.921666       511
## 4      Pied-billed Grebe 35.996441   3.610822       763
## 5       Long-tailed Duck  8.053587   3.589455       786
## 6 Golden-crowned Kinglet 32.860078   3.522237       873
## # ... with 1 more variables: sciName.edge <chr>
myedge also can provide a separate data frame for each country when
used in conjunction with dplyr::do:
mybirds %>%
  group_by(Country) %>%
  do(myedge(., edge.cutoff = 500)) %>%
  select(-sciName)
## Source: local data frame [17 x 6]
## Groups: Country [6]
##
##                     Country                  comName  ED.Score EDGE.Score
##                       <chr>                    <chr>     <dbl>      <dbl>
## 1                 Australia Australian Painted-Snipe 26.901620   5.408126
## 2                 Australia      Hutton's Shearwater  8.341314   4.313888
## 3                 Australia             Magpie Goose 62.675689   4.153803
## 4                 Australia                   Osprey 56.063247   4.044160
## 5                 Australia               Great Knot 12.885775   4.017159
## 6                 Australia         Beach Thick-knee 26.631221   4.012094
## 7                 Australia   Yellow-nosed Albatross  5.730249   3.986054
## 8                 Australia        Providence Petrel 11.894030   3.943059
## 9                    Canada         Marbled Murrelet  8.815285   4.363382
## 10                   Canada                   Osprey 56.063247   4.044160
## 11                    Chile   Peruvian Diving-Petrel 28.418480   5.461065
## 12                    Chile            Andean Condor 43.702267   4.493171
## 13                    Chile          Andean Flamingo 15.887414   4.212863
## 14               Costa Rica                   Osprey 56.063247   4.044160
## 15                Nicaragua                   Osprey 56.063247   4.044160
## 16 United States of America         Marbled Murrelet  8.815285   4.363382
## 17 United States of America                   Osprey 56.063247   4.044160
## # ... with 2 more variables: EDGE.Rank <int>, sciName.edge <chr>
Problems with ED
As it has been previously pointed out, there are some issues with composite indices of evolutionary distinctiveness. One important problem with ED estimates is that they can be very sensitive to splits or lumps at the species level. Let’s take the hypothetical example presented in the tree above, but this time using a taxonomy that considers species A to actually be three separate species (A, E, and F) which split around 0.2 million years (MY) before present:
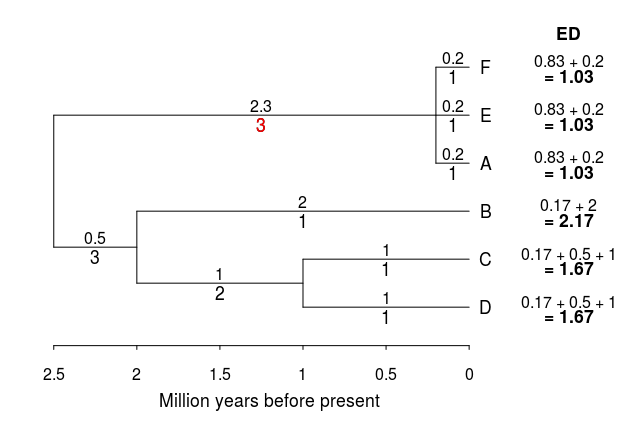
Using this taxonomy, the ED score of species A drastically drops, even though it is still nested in a very long branch. One way around this is to change the focus from scoring individual species (which is sexy) and instead look at the phylogenetic diversity of a community of species (not as sexy).
Phylogenetic Diversity
One neat way to estimate phylogenetic diversity of a clade is to simply add all branches of a tree; this represents the total evolutionary time covered by the species in the clade/tree. Again with our hypothetical four species, if we wanted to calculate PD for species B and C:
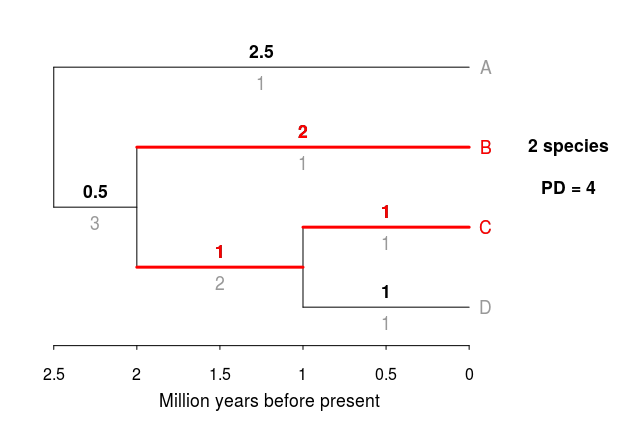
Our estimate of PD for species B and C is 4 MY of evolution. Now, if we also include species D, our estimate of PD will increase only slightly as species C and D are closely related.
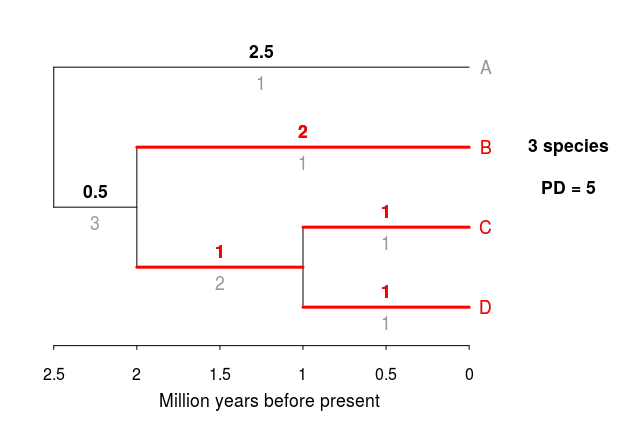
On the other hand, if we include species A instead of species D, the phylogenetic diversity of this group will be much higher, as including species A means a much longer branch of evolutionary time is now being added:
The function mypd does exactly this: it calculates the phylogenetic
distance of the species in your eBird checklist based on the Jetz et al.
phylogeny. It is very straightforward to run, however it averages values
across 20 very large trees, and therefore is a bit slow to run
(shouldn’t take more than a minute though):
mypdvalues <- mypd(mybirds)
mypdvalues
## # A tibble: 1 × 3
##    mean_pd median_pd    sd_pd
##      <dbl>     <dbl>    <dbl>
## 1 20917.93  20755.27 1247.857
This means that the combined phylogenetic distance of the species recorded in all my eBird checklists encompasses 20.8 billion years of evolution!
As with the myedge function, you can look at PD values by country:
mybirds %>%
  group_by(Country) %>%
  do(mypd(.))
## Source: local data frame [16 x 4]
## Groups: Country [16]
##
##                             Country   mean_pd median_pd     sd_pd
##                               <chr>     <dbl>     <dbl>     <dbl>
## 1                         Argentina 2426.8959 2403.6887 121.87432
## 2                         Australia 7679.9299 7596.6293 466.10298
## 3                            Canada 6226.8165 6172.2301 357.44688
## 4                             Chile 5746.2029 5813.5036 277.16189
## 5                             China 1615.5454 1605.0135 104.20097
## 6                        Costa Rica 5331.2497 5273.0615 323.00325
## 7                           Estonia  782.8760  776.5314  55.08342
## 8                             Italy 2097.5834 2085.1940 133.16929
## 9  Lao People's Democratic Republic  576.1632  573.7042  39.61243
## 10                         Malaysia 1473.7752 1458.2762  94.28255
## 11                      Netherlands 2495.7160 2466.9962 140.25366
## 12                        Nicaragua 1569.0076 1567.9522  96.66135
## 13                        Singapore 1615.6165 1592.0610 108.28689
## 14                         Thailand 3207.9384 3154.9717 242.42609
## 15         United States of America 6125.7561 6052.1918 336.01728
## 16                          Vanuatu 1282.8242 1281.9231  80.43118
and even by county/region within a state or province (in this example, regions within British Columbia):
mybirds %>%
  filter(State.Province == "CA-BC") %>%
  group_by(County) %>%
  do(mypd(.))
## Source: local data frame [15 x 4]
## Groups: County [15]
##
##                    County   mean_pd median_pd     sd_pd
##                     <chr>     <dbl>     <dbl>     <dbl>
## 1       Alberni-Clayoquot 1151.9561 1140.2276  63.73931
## 2                 Capital 2981.2589 2970.1906 160.05197
## 3        Central Okanagan 2367.7571 2347.5893 142.14835
## 4        Columbia-Shuswap 1442.1585 1444.1457  70.47375
## 5        Comox-Strathcona 1068.2720 1066.9558  44.22091
## 6           Fraser Valley 2447.5208 2436.1617 134.31824
## 7       Kootenay Boundary 1797.7464 1768.6904 116.87098
## 8         Metro Vancouver 5505.4194 5458.0431 315.90021
## 9        Mount Waddington 1232.4101 1223.7951  71.03491
## 10                Nanaimo  768.0895  762.9666  43.55813
## 11   Okanagan-Similkameen 3934.0560 3907.4926 234.13345
## 12 Skeena-Queen Charlotte  354.8324  350.6889  19.17975
## 13      Squamish-Lillooet 1825.5306 1803.6692 114.35689
## 14         Sunshine Coast 1528.9859 1511.2885  77.00035
## 15        Thompson-Nicola 2503.5555 2483.0836 147.10740
Are ED and PD correlated?
Arne Mooers, who is a co-author of the bird tree paper, mentioned to me that there is often a strong correlation between ED and PD across species lists. With these two functions, it is easy to look at the relationship between PD and sum of EDs for a bunch of different lists, for example, ED and PD values by country:
# calculating ED by country
edcountry <- mybirds %>%
  group_by(Country) %>%
  do(myedge(.)) %>%
  select(-sciName) %>%
  summarise(EDs = sum(ED.Score), n = n())

# calculating PD by country
pdcountry <- mybirds %>%
  group_by(Country) %>%
  do(mypd(.))

edpdcountry <- left_join(edcountry, pdcountry, by = "Country")

# fitting linear model and extracting coefficients to print on plot
m <- lm(EDs ~ median_pd, edpdcountry)
rout <- list(paste('Fitted model: ', round(coef(m)[1], 3), ' + ',
                               round(coef(m)[2], 3), '* PD', sep = ''),
              paste('R^2 == ', round(summary(m)[['r.squared']], 3),
                    sep = ''))

ggplot(data = edpdcountry, aes(median_pd, EDs, size = n)) +
  geom_point(color = "grey60") +
  ggtitle("ED and PD by country") +
  geom_smooth(method = "lm", show.legend = FALSE) +
    geom_text(aes(label = Country), size = 4,
            nudge_y = -100, check_overlap = TRUE) +
  geom_label(aes(x = 500, y = 3000, label = rout[[1]]), hjust = 0,
             size = 5,  inherit.aes = FALSE) +
  geom_label(aes(x = 500, y = 2600, label = rout[[2]]), hjust = 0, size = 5,
            inherit.aes = FALSE, parse = TRUE)
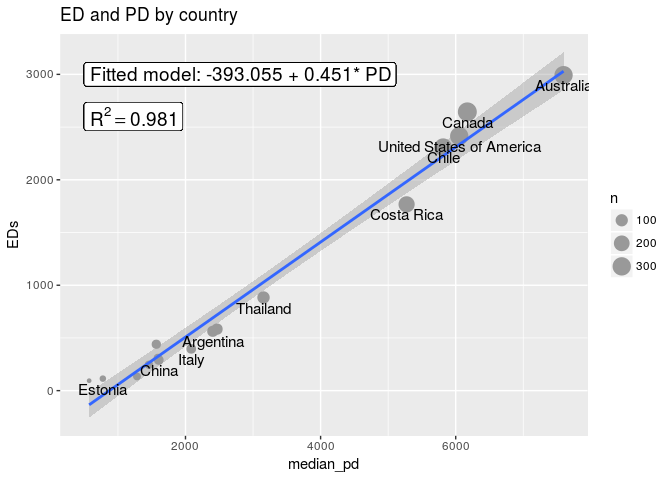
At least in the example above, PD and ED are strongly correlated, with an \(R^2\) of 0.98 and a coefficient of 0.45, which indicates that the sum of ED scores for a group of species is roughly half of the PD covered by that same group.
Lastly, the edge object provides a data frame that is useful for the
two previous functions as it links the Jetz et al. (2014) phylogeny with
your eBird checklist. You can peruse it independently, as it shows
updated scientific names, common names, and EDGE scores and ranks as
reported by the Jetz et al. paper:
edge
## # A tibble: 9,993 × 6
##                    sciName                       comName ED.Score
##                      <chr>                         <chr>    <dbl>
## 1       Pseudibis gigantea                    Giant Ibis 56.62592
## 2        Aegotheles savesi New Caledonian Owlet-nightjar 40.26083
## 3  Gymnogyps californianus             California Condor 33.39032
## 4      Strigops habroptila                        Kakapo 32.37154
## 5      Rhynochetos jubatus                          Kagu 55.38186
## 6  Houbaropsis bengalensis               Bengal Florican 24.27388
## 7          Athene blewitti                  Forest Owlet 24.08449
## 8    Pithecophaga jefferyi              Philippine Eagle 23.63732
## 9         Fregata andrewsi  Christmas Island Frigatebird 22.67818
## 10     Carpococcyx viridis        Sumatran Ground-cuckoo 21.15445
## # ... with 9,983 more rows, and 3 more variables: EDGE.Score <dbl>,
## #   EDGE.Rank <int>, sciName.edge <chr>
The species with the highest EDGE score is the Giant Ibis, which is classified as Critically Endangered by the IUCN (GE = 4) and also has the highest ED score among all Critically Endangered bird species.
Important note: There are many discrepancies between the taxonomy
used in the Jetz paper and that one used in eBird; the latter even gets
updated yearly! I’ve wrangled both species lists to try and match as
many species as possible (you can see the code
here),
however the coverage is not perfect as there are many species which have
been recently split and can’t be matched either by common or scientific
name. Unfortunately, any species in your eBird checklists that can’t be
matched to the Jetz phylogeny are ignored by myedge and mypd, yet
there isn’t many of them (~50 out of 1300+ species in my checklist)
however, this shouldn’t affect (too much) the species with highest EDGE
scores or considerably bias PD estimates.

Bugs/Problems?
This package is still a work in progress, so if you find any issues/bugs/problems please let me know. There are a few more features I’d like to add (e.g., graphing functions, plotting location of sightings on a map, to name a few); but any ideas are welcome!
References
Isaac, N. J. B., Turvey, S. T., Collen, B., Waterman, C. & Baillie, J. E. M. (2007) Mammals on the EDGE: Conservation Priorities Based on Threat and Phylogeny. PLOS ONE, 2, e296. http://journals.plos.org/plosone/article?id=10.1371/journal.pone.0000296
Jetz, W., Thomas, G. H., Joy, J. B., Redding, D. W., Hartmann, K. & Mooers, A. O. (2014) Global Distribution and Conservation of Evolutionary Distinctness in Birds. Current Biology, 24, 919–930. http://www.cell.com/current-biology/fulltext/S0960-9822(14)00270-X